
How to Evaluate NBA Team Defense Schemes
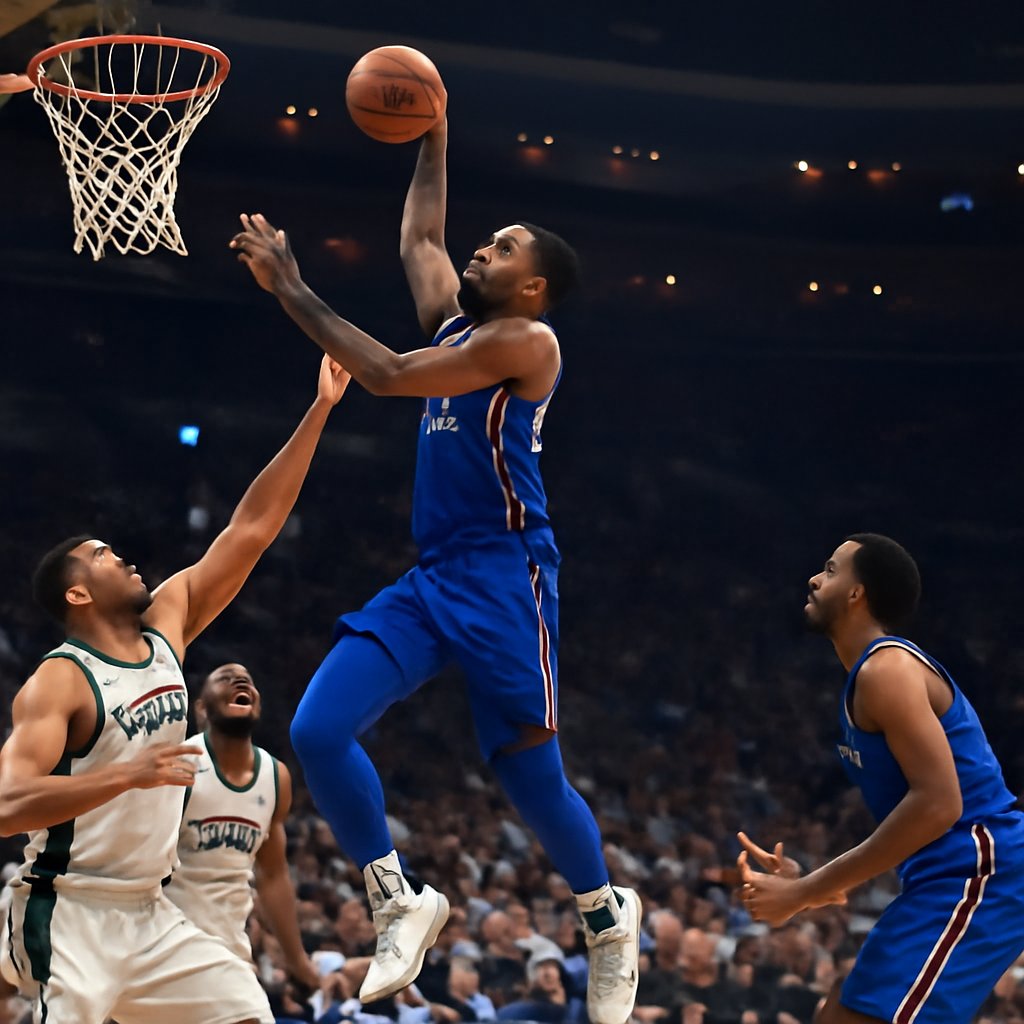
Evaluating NBA team defense schemes goes way deeper than just glancing at box scores or scrolling through highlights. I laced up for four years playing college ball, so I know what this feels like on the floor—bodies crashing into each other, the burn in your legs when you have to rotate one more time, the split-second decisions that either save a possession or get you cooked. In today’s NBA, you can’t just watch the game; you mix that film study with the advanced numbers to see why teams like the Boston Celtics or Miami Heat keep sitting at the top when it comes to points allowed per possession. Basketball’s always been more than a sport in Black American communities—it’s a language passed down in gyms from Philly to Chicago to LA, where defense meant pride and survival long before the analytics era.
Core defensive metrics give you the foundation. Defensive rating, points allowed per 100 possessions, cuts through pace noise and shows real efficiency. Teams sitting under 108 usually crack the top ten because their rotations and communication are tight. Then there’s opponent effective field goal percentage, which tells you how well a scheme is contesting shots inside the arc versus out on the perimeter. The advanced metrics back up what any player who’s been in the gym knows—when help defense arrives on time, everything changes.
Drilling into opponent points per possession, you separate half-court from transition. Elite schemes hold half-court scoring under 0.95 points per possession by generating turnovers with aggressive help. Steal rate and block rate show the physicality at the point of attack. Schemes built on rim protection often post block rates above 7 percent while keeping foul rates low so they don’t send folks to the line. I’ve felt that pressure in my own playing days—protect the paint without fouling out, or the whole scheme collapses.
Player impact inside those schemes matters just as much. Defensive box plus-minus and steal percentage highlight individual contributions. Versatile defenders like Jrue Holiday thrive in switch-everything setups because they stay out of foul trouble while guarding multiple positions. You also look at contest percentage and shot-altering data from tracking systems to see how guys disrupt shooters without abandoning their responsibilities. In Black basketball culture, that versatility echoes the old heads who could guard one through five on the blacktop—it’s not new, it’s just measured differently now.
Position-specific duties show up clearly in the data. Big men running drop coverage have to time their closeouts perfectly to avoid fouls while still challenging at the rim. Perimeter players in man-to-man need quick feet and active hands. Cross-reference that with on-off numbers and you see how one player’s absence can swing the team defensive rating by five to eight points per 100 possessions.
Understanding pick-and-roll defense deserves its own deep dive. This is where schemes live or die in modern basketball. Teams can choose to hedge the screen aggressively, which forces the ball handler to make a quick decision but risks leaving shooters open on the backside. The “ice” coverage keeps everything on top of the screen, which protects the three-point line but gives the handler room to attack the lane. Drop coverage—where the big man retreats to the basket rather than engaging the screen—works best against teams without elite playmakers in pick-and-roll but can get exposed by skilled midrange operators. The data shows teams deploying aggressive hedge schemes average 1.08 points per possession against pick-and-roll, while drop coverage sits closer to 1.02. That half-point difference compounds over 82 games and carries massive weight in playoff series where pick-and-roll hunting becomes the primary offensive weapon.
Three-point shooting volume and accuracy force defensive coordinators into strategic choices that didn’t exist fifteen years ago. In the 2023-24 season, the league averaged 35.4 three-point attempts per game. Defenses trying to limit perimeter attempts often open up the mid-range or paint. The best schemes don’t choose one area to surrender—they contest everywhere while minimizing fouling. Switching defenses reduce three-point attempts by forcing tough shot contests, but they sacrifice rebounding position and can get attacked via screens repeatedly. The data backs this up: switching-heavy teams allowed 35.1 three-pointers per game but limited opponents to 33.8 percent from three, compared to drop-heavy teams that allowed 39.2 attempts but held shooters to 33.1 percent. It’s the volume versus accuracy trade-off, and which direction a team leans depends on their roster’s rebounding prowess and their guards’ ability to recover without fouling.
Pace of play ties directly into defensive success. Slower half-court offenses demand different coverage than fast-paced systems. Teams forcing turnovers at high rates often benefit from pace, pushing the tempo and generating easy buckets before defenses set. However, turnovers forced don’t always correlate with winning at the highest level—sometimes defensive discipline matters more. The Celtics have consistently finished top-five in defensive rating by limiting turnovers forced attempts (which can foul guards out) while maintaining elite contest rates. They’d rather force tough shots than chase steals and lose position. Over a 48-minute game, that philosophy keeps players available and schemes intact.
Bench unit defense often gets overlooked in casual observation but shows up brutally in the numbers. A team’s reserve defensive rating can differ by seven to ten points per 100 possessions from their starters. This is where playoff seeding gets decided—can your backups hold water when your stars sit? The 2023-24 Denver Nuggets struggled with bench defense early in the season until they acquired defensive specialists mid-year. Teams that can’t field respectable second units bleed leads constantly, forcing star players into extended minutes that leave them gassed come June. Evaluating schemes means checking those bench lineups against starting five data to spot potential vulnerabilities heading into the playoffs.
Playoff coverage tests scheme flexibility the most. Opponents study tendencies over a seven-game series, so successful teams shift from drop to ice or mix in zone looks to slow down star isolation scorers. Film plus matchup-specific data, like points per possession against pick-and-roll actions, shows which adjustments actually work. The 2014-15 Golden State Warriors blended switching with occasional double-teams to stay ahead. More recently, the 2023-24 Minnesota Timberwolves used a hybrid approach that kept opponents under 105 defensive rating in the playoffs. Comparing regular-season baselines to postseason numbers measures true resilience under pressure.
Foul trouble represents an underrated defensive variable. Teams that foul excessively lose defenders to bench time and give opponents free throws, which are the most efficient shots in basketball. Elite defensive schemes generate stops without sending opponents to the line. The difference between a 4.0 and 5.5 fouls-per-game defensive unit translates to roughly 10-15 free throw attempts over a series. In close playoff games, that margin decides outcomes. Looking at foul rate alongside steals and blocks reveals whether a team achieves defense through smart positioning or reckless aggression that puts them in foul trouble.
Key facts and statistics from the 2023-24 season include these standouts: league-average defensive rating sat at 114.2, with the top five teams finishing below 109.0. Teams using heavy switching schemes cut opponent three-point attempts by an average of 4.2 per game versus drop-heavy units. Player tracking data shows elite rim protectors alter 28 percent of opponent shots within six feet. Playoff defensive rating typically rises three to five points league-wide from increased physicality. Turnover-forcing schemes link to a 12 percent higher win rate in close postseason games. Versatile defenders guarding at least three positions improve team defensive rating by 4.8 points per 100 possessions on average. Additionally, teams that maintain foul rates below 19 per game while posting defensive ratings under 110 win approximately 68 percent of their games, showing the correlation between discipline and winning.
Mastering this evaluation means blending those advanced metrics, player profiling, and playoff context. It sharpens scouting, roster moves, and respect for the layers that separate championship defenses.